13th Lesson Statistics Class 10 Important Questions with Solutions
10th Class Maths Statistics 1 Mark Important Questions
Question 1.
If the mean and the median of a data are 12 and 15 respectively, then find its mode.
Solution:
Mode = 3 median - 2 mean
= 3 × 15 - 2 × 12 = 45 - 24 = 21.
Question 2.
If every term of the statistical data consisting of n terms is decreased by 2, then the mean of the data :
A) decreases by 2
B) remains unchanged
C) decreases by 2n
D) decreases by 1
Solution:
A) decreases by 2
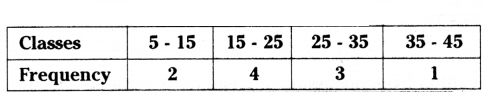
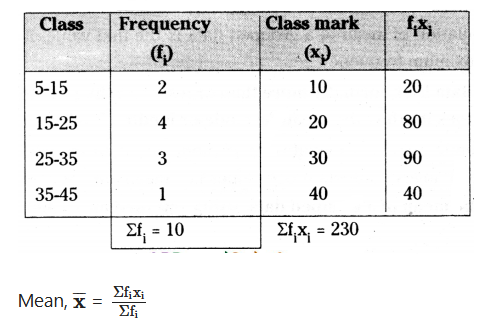
Question 3.
For the following distribution :
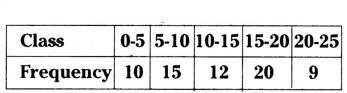
Find the lower limit of modal class.
Solution:
Lower limit of modal class = 15+15/2 = 30/2 = 15
Question 4.
Consider the following frequency distribution :
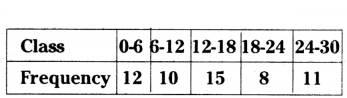
Find the median class.
Solution:
N = 12 + 10 + 15 + 8 + 11 = 56
N/2 = 56/2 = 28
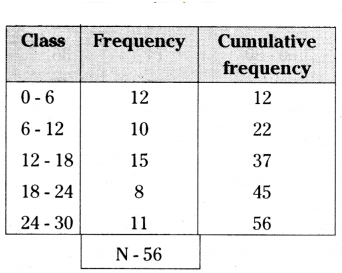
N/2 = 56/2 = 28
∴ Median classes = 12 - 18.
Question 5.
For the following distribution :
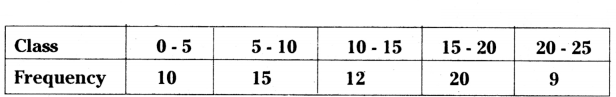
The sum of lower limits of median class and modal class.
Solution:
Modal Class = 15 - 20
| Class |
frequency |
cf |
| 0 - 5 |
10 |
10 |
| 5 - 10 |
15 |
25 |
| 10 - 15 |
12 |
37 |
| 15 - 20 |
20 |
57 |
| 20 - 25 |
9 |
66 |
|
N = 66 |
|
N/2 = 66/2 = 33
Median Class = 10 - 15
lower limit of median class + lower limit of model class 10 + 15 = 25
Question 6.
Find the median class for the data given below.
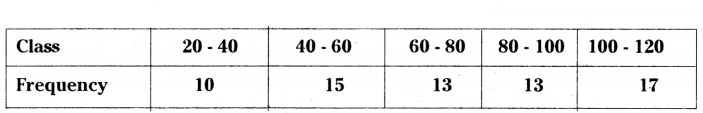
Solution:
| Class |
frequency |
cf |
| 20 - 40 |
10 |
10 |
| 40 - 60 |
12 |
22 |
| 60 - 80 |
14 |
36 |
| 80 - 100 |
13 |
49 |
| 100 - 120 |
17 |
66 |
|
N = 66 |
|
N/2 = 66/2 = 33
Median Class = 60 - 80
Question 7.
Mean and median of some data are 32 and 30 respectively. Using empirical relation, find the mode of the data.
Solution:
Mode = 3 Median - 2 mean
= 3 × 30 - 2 × 32 = 90 - 64 = 26
Question 8.
If the mean of the first n natural number is 15, then find n.
Solution:
Mean of first ‘n’ natural numbers
= n(n+1)/2n = (n+1)/2 = (n+1)/2 = 15
= n + 1 = 30 = n = 30 - 1 = n = 29.
Question 9.
Find the class marks of the classes 20 - 50 and 35 - 60.
Solution:
Class marks of 20 - 50 = 20+50/2 = 70/2
= 35
Class mark of 35 - 60 = 35+60/2 = 95/2 = 47.5
Question 10.
For the following frequency distribution.
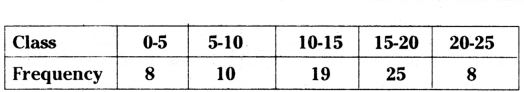
Find the upper limit of median class.
Solution:
| Class |
Frequency |
cf |
| 0-5 |
8 |
8 |
| 5 - 10 |
10 |
18 |
| 10 - 15 |
19 |
37 |
| 15 - 20 |
25 |
62 |
| 20 - 25 |
8 |
70 |
|
N = 20 |
|
N/2 = 70/2
Median class = 10 - 15
Upper limit = 15
Question 11.
If the mean of the following distribution is 2.6, then find the value of y.
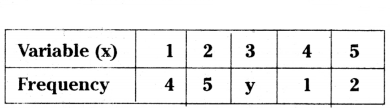
Solution:
| x |
f |
fx |
| 1 |
4 |
4 |
| 2 |
5 |
10 |
| 3 |
y |
3y |
| 4 |
1 |
4 |
| 5 |
2 |
10 |
N = 12 + y Σfx = 28 + 3y
Mean = 2.6
28+3y/12+y = 2.6 ⇒ 28 + 3y = 2.6(12 + y)
28 + 3y = 31.2 + 2.6y
3y - 2.6y = 31.2 - 28
0.4y = 3.2 ⇒ y = 32/4 ⇒ y = 8
Question 12.
The time in seconds, taken by 150 athletes to turn a 100 m hurdle race are tabulated below:
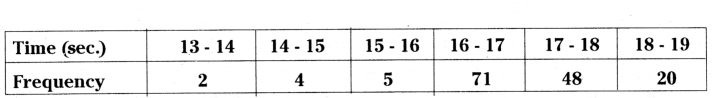
Find the number of athletes who completed the race in less than 17 seconds.
Solution:
| Class |
Frequency |
cf |
| 13 - 14 |
2 |
2 |
| 14 - 15 |
4 |
6 |
| 15 - 16 |
5 |
11 |
| 16 - 17 |
71 |
82 |
| 17 - 18 |
48 |
130 |
| 18 - 19 |
20 |
150 |
|
N = 150 |
|
N/2 = 150/2
Number of athlets who completed the race lessthan 17 records is 82.
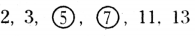
Question 13.
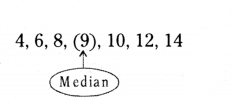
Find the median of first seven prime numbers.
Solution:
The first seven prime numbers are 2, 3, 5, 7, 11, 13, 17
median = 7
Question 14.
If the mean of 6, 7, x, 8, y, 14 is 9, then
A) x + y = 21
B) x + y = 19
C) x - y = 19
D) x - y = 21
Solution:
B) x + y = 19
Mean = 6+7+x+8+y+14/6
9 = 35+y+x/6
54 = 35 + x + y
x + y = 54 - 35
x + y = 19
Question 15.
Find the mode of the numbers 2, 3, 3, 4, 5, 4, 4, 5, 3, 4, 2, 6, 7.
Solution:
4 repeated more times
∴ Mode = 4
Question 16.
Write the empirical relationship between the three measures of central tendency.
Solution:
Mode = 3 median - 2 mean (or)
2 Mean = 3 median - mode (or)
3 Median = Mode + 2 mean
Question 17.
Median and Mode of a distribution are 25 and 21 respectively. Find the mean of the data using empirical relationship.
Solution:
Mode = 3 median - 2 mean
21 = 3 x 25 - 2 × mean
21 = 75 - 2 mean
2 mean = 75 - 21
2 mean = 54
Mean = 54/2 = 27
Question 18.
Find the class-marks of the classes 10 - 25 and 35 - 55.
Solution:
Class marks of 10 - 25 = 35/2 = 17.5
Class marks of 35 - 55 = 90/2 = 45
Question 19.
Write the mean of first ’n’ natural numbers.
Solution:
Mean = 1+2+3+..n/n
= n(n+1)/2n = n+1/2
Question 20.
If xi and fi are numerically small, then which method is appropriate choice to find mean.
Solution:
Direct method
Question 21.
_________ based on all observations.
A) Range
B) Mean
C) Median
D) Mode
Solution:
A) Range
Question 22.
If the median of a series exceeds the mean by 3. Find by what number the mode exceeds its mean.
Solution:
Given, median - mean = 3
median = 3 + mean
mode = 3 median - 2 mean
mode = 3(3 + mean) - 2 mean
mode = 9 + 3 mean - 2 mean
mode = 9 + mean
mode - mean = 9
Question 23.
Find the median class from the following frequency distribution.
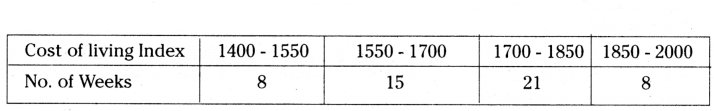
Solution:
N = 8 + 15 + 21 + 8 = 52
N/2 = 52/2
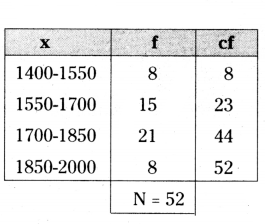
Median class = 1550 - 1700
Question 24.
The median of the data, using an emperical relation when it is given that mode = 12.4, Mean = 10.5
Solution:
Mode = 3 median - 2 mean
12.4 = 3 median -2 (10.5) ⇒ 12.4 = 3 median - 21
12.4 + 21 = 3 median ⇒ 33.4 = 3 median
Median = 33.4/3 = 11.13
Question 25.
In the following frequency distribution, the median class.
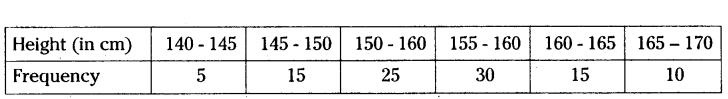
Solution:
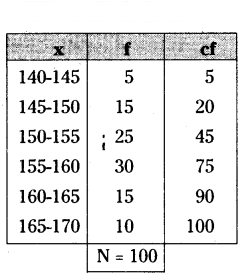
N/2 = 100/2 = 50
Median Class = 150 - 155
Question 26.
Mode of a data is 10, one observation 4 is added to the data then find the mode.
Solution:
There is no change in mode.
∴ Mode = 10
Question 27.
Find the mode of letters A, B, C, D ..Z.
Solution:
No mode
Question 28.
Mean of a data is 11. Each observation is added by 2 then find the mean of new observation.
Solution:
New mean = 11 + 2 = 13
Question 29.
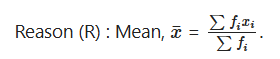
Assertion (A) : Am of 7, 4, 9 is 8.2
Reason (R) : Am = Sum of observations/No. of observations
A) Both Assertion (A) and Reason (R) are true and Reason (R) is the correct explanation of Assertion (A).
B) Both Assertion (A) and Reason (R) are true but Reason (R) is not the correct explanation of Assertion (A).
C) Assertion (A) is true but Reason (R) is false.
D) Assertion (A) is false but Reason (R) is true.
Solution:
D) Assertion (A) is false but Reason (R) is true.
Question 30.
Assertion (A) : Midvalue of class 0 - 10 is 5
Reason (R) : Range = Maximum value - Minimum value
A) Both Assertion (A) and Reason (R) are true and Reason (R) is the correct explanation of Assertion (A).
B) Both Assertion (A) and Reason (R) are true but Reason (R) is not the correct explanation of Assertion (A).
C) Assertion (A) is true but Reason (R) is false.
D) Assertion (A) is false but Reason (R) is true.
Solution:
B) Both Assertion (A) and Reason (R) are true but Reason (R) is not the correct explanation of Assertion (A).
Question 31.
Assertion (A) : Mode of 1, 2, 3, . 10 is 10.
Reason (R) : Mode = 3 median - 2 mean
A) Both Assertion (A) and Reason (R) are true and Reason (R) is the correct explanation of Assertion (A).
B) Both Assertion (A) and Reason- (R) are true but Reason (R) is not the correct explanation of Assertion (A).
C) Assertion (A) is true but Reason (R) is false.
D) Assertion (A) is false but Reason (R) is true.
Solution:
D) Assertion (A) is false but Reason (R) is true.
Question 32.
Assertion (A) : The mean of the following data is 412.
A) Both Assertion (A) and Reason (R) are true and Reason (R) is the correct explanation of Assertion (A).
B) Both Assertion (A) and Reason (R) are true but Reason (R) is not the correct explanation of Assertion (A).
C) Assertion (A) is true but Reason (R) is false.
D) Assertion (A) is false but Reason (R) is true.
Solution:
D) Assertion (A) is false but Reason (R) is true.
Question 33.
Assertion (A) : Mean of x, y, z is 4 then mean of 2x, 2y, 2z is 8.
Reason (R) : If there are two values in a data after arranging either in ascen-ding or descending order, the average of those two values is called median of that data.
A) Both Assertion (A) and Reason (R) are true and Reason (R) is the correct explanation of Assertion (A).
B) Both Assertion (A) and Reason (R) are true but Reason (R) is not the correct explanation of Assertion (A).
C) Assertion (A) is true but Reason (R) is false.
D) Assertion (A) is false but Reason (R) is true.
Solution:
B) Both Assertion (A) and Reason (R) are true but Reason (R) is not the correct explanation of Assertion (A).
Question 34.
Assertion (A) Midvalues are used to calculate mean.
A) Both Assertion (A) and Reason (R) are true and Reason (R) is the correct explanation of Assertion (A).
B) Both Assertion (A) and Reason (R) are true but Reason (R) is not the correct explanation of Assertion (A).
C) Assertion (A) is true but Reason (R) is false.
D) Assertion (A) is false but Reason (R) is true.
Solution:
C) Assertion (A) is true but Reason (R) is false.
Question 35.
Assertion (A) : In step-deviation method of finding mean, ui = xi-a/h.
Reason (R) : A data may or may not have mode.
A) Both Assertion (A) and Reason (R) are true and Reason (R) is the correct explanation of Assertioh (A).
B) Both Assertion (A) and Reason (R) are true but Reason (R) is not the correct explanation of Assertion (A).
C) Assertion (A) is true but Reason (R) is false.
D) Assertion (A) is false but Reason (R) is true. .
Solution:
B) Both Assertion (A) and Reason (R) are true but Reason (R) is not the correct explanation of Assertion (A).
Question 36.
In the formula of mean of grouped data in step deviation method x = A + (Σfiui/Σfi) × h; where ui = ________
Solution:
ui = xi-a/h.
Question 37.
In the classes 35 - 39, 40 - 44, 45 - 49,.. of a frequency distribution, then the upper boundary of the class 40 - 44 is __________ .
Solution:
44.5
Question 38.
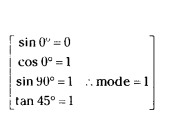
Assertion (A) : Mode of sin 0°, cos 0°, sin 90° and tan 45° is 0.
Reason (R) : x = Σf/Σfi
Choose the correct answer:
A) Both Assertion and Reason are true. Reason is supporting the Assertion.
B) Both Assertion and Reason are true. But Reason is not supporting the Assertion.
C) Assertion is true but the Reason is false.
D) Assertion is false but the Reason is true.
Solution:
D) Assertion is false but the Reason is true.
Question 39.
From the given frequency distribution table, what is the class interval of highest frequency class ?
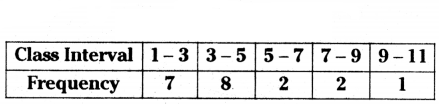
Solution:
2 (class 3 - 5)
Question 40.
Find the mean of the given data :
2, 3, 7, 6, 6, 3, 8
Solution:
Data = 2, 3, 7, 6, 6, 3, 8
Numbers = 7
Total = 2 + 3+7 + 6 + 6 + 3 + 8 = 35
Mean = 35/7 = 5
10th Class Maths Statistics 2 Mark Important Questions
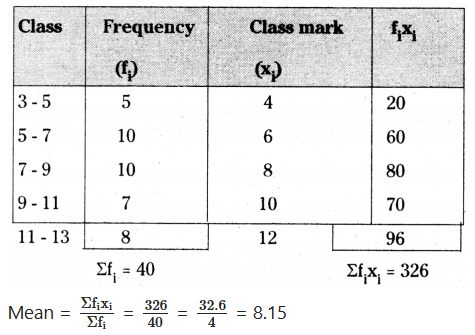
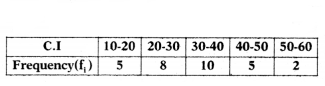
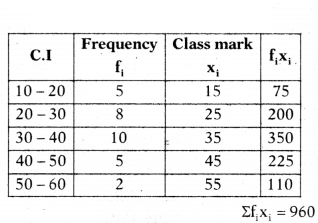
Question 1.
Find the mean the following distribution :
| Class |
Frequency |
| 3 - 5 |
5 |
| 5 - 7 |
10 |
| 7 - 9 |
10 |
| 9 - 11 |
7 |
| 11 - 13 |
8 |
Solution:
Question 2.
Find the mode of the following data :
| Class |
Frequency |
| 0 - 20 |
6 |
| 20 - 40 |
8 |
| 40 - 60 |
10 |
| 60 - 80 |
12 |
| 80 - 100 |
6 |
| 100 - 120 |
5 |
| 120 - 140 |
3 |
Solution:
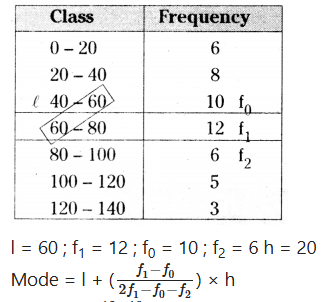
= 60 + (12-10/2×12-10-6) × 20
= 60 + 2×20/24-16
= 60 + 40/8
= 60 + 5 = 65.
Question 3.
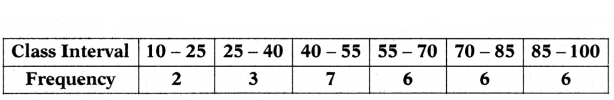
Find the mode of the following frequency distribution :
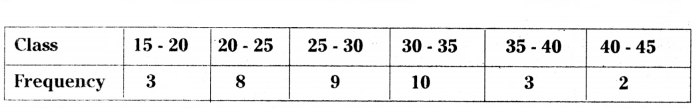
Solution:
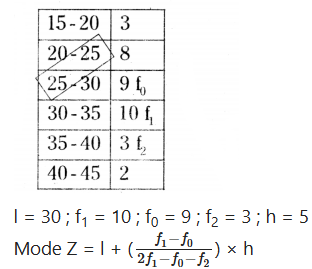
= 30 + (10-9/2×10-9-3) × 5
= 30 + (5/20-12) = 30 + 40/8
Mode = 30 + 0.625 = 30.625
Question 4.
Find the mean for the following distribution :
Solution:
Question 5.
The following distribution shows the transport expenditure of 100 employees :
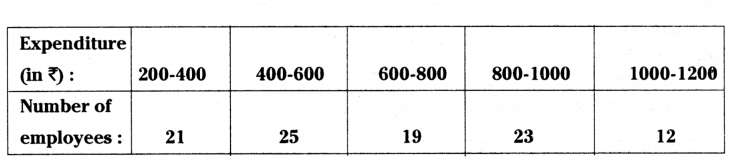
Solution:
Find the mode of the distribution.
l = 400 ; f0 = 25 ; f1 = 21 ; f2 = 19 ; h = 200
Mode, Z = l + (f1-f0/2f1-f0-f2) × h
= 400 + (25-21/2×25-21-19) × 200
= 400 + (4×200/50-40) × 400 + 800/10
= 400 + 80 = 480
Question 6.
How do you find the deviation from the assumed mean for the above data ?
Solution:
The assumed value in calculation of mean of a grouped data is the mid value of the class interval which has maximum frequency.
Question 7.
When an observation in a data is abnormally more than or less than the remaining observations in the data, does it affect the mean or mode or median ? Why ?
Solution:
Mean and medians are depending upon given data except mode. So when an observa¬tion in a data is abnormally changes it affects those values i.e., mean and median.
Question 8.
Write the formula to find the mean of a grouped data, using assumed mean method and explain each term.
Solution:
Mean = a + Σfidi/Σfi
a - assumed mean, f - frequency,
d - x - a, x - class mark
Question 9.
The median of observations, -2, 5, 3, -1, 4, 6 is 3.5?. Is it correct ? Justify your answer.
Solution:
Yes.
Given data : -2, 5, 3, -1, 4, 6
Ascending order : -2, -1, 3, 4, 5, 6
Median = 3+4/2 = 7/2 = 3.5
Question 10.
Prathyusha stated that "the average of first 10 odd numbers is also 10". Do you agree with her ? Justify your answer.
Solution:
The average of first 10 odd numbers
= 10/2 [1+19]/10 = 5×20/10 = 100/10 = 10
∴ The average of first 10 odd numbers is 10.
I agree with Prathyusha statement. l
Question 11.
Write the formula to find the median of a grouped data and explain the alphabet in it.
Solution:
Median = l + [n/2-cf/f] × h
l = lower boundary of median class,
n =number of observations.
cf = cumulative frequency of class preceeding the median class,
f = frequency of median class,
h = class size.
Question 12.
Find the median of first seven composite numbers.
Solution:
The first seven composite numbers are
∴ Median = 9
Question 13.
Find the mode of the data 6, 8, 3, 6, 3, 7, 4, 6, 7, 3, 6.
Solution:
First we arrange the ascending order
3, 3, 3, 4, 6, 6, 6, 6, 7, 7, 8
| x |
frequency |
| 3 |
3 |
| 4 |
1 |
| 6 |
4 |
| 7 |
2 |
| 8 |
1 |
∴ Mode (6) [having maximum frequency]
Question 14.
Find the mean of prime numbers which are less than 30.
Solution:
Mean = sum of the observation/number of the observation
= 2+3+5+7+11+13+17+19+23+29/10 = 129/10 = 12.9
Question 15.
Find the median of 2/3 , 4/5, 1/2, 3/4, 6/5, 1/2.
Solution:
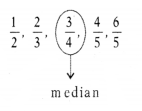
∴ Median = 3/4
10th Class Maths Statistics 4 Mark Important Questions
Question 1.
ArIthmetic mean of the following data is 14. FInd the value of k.
| xi |
5 |
10 |
15 |
20 |
25 |
| fi |
7 |
k |
8 |
4 |
5 |
Solution:
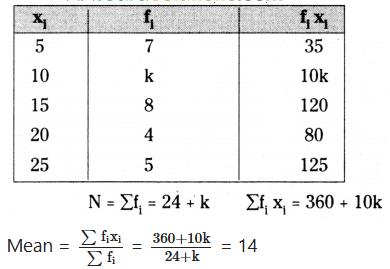
360+ 10k = 14(24 + k)
360 + 10k = 336 + 14k
10k - 14k = 336 - 360
-4k = -24
k = 24/4 = 6
∴ k = 6
Question 2.
If the mean of the following data is 18.75. Find the value of p.
| xi |
10 |
15 |
15 |
25 |
30 |
| fi |
5 |
10 |
10 |
8 |
2 |
Solution:
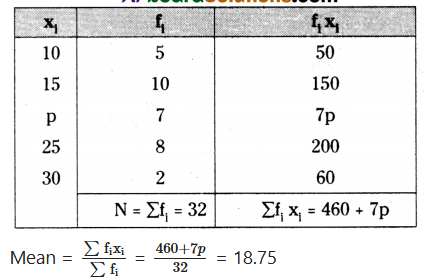
460 + 7p = 18.75 × 32
460 + 7p = 600
7p = 600 - 460
7p = 140
P = 140/7 = 20
∴ p = 20
Question 3.
The heights of six members of a family are given below in the table.
| Height in feet |
5 |
5.2 |
5.4 |
5.6 |
| No. of family members |
1 |
2 |
2 |
1 |
Find the mean height of the family members.
Solution:
| Height in feet (x) |
No. of family members (f) |
f × x |
| 5 |
1 |
5 |
| 5.2 |
2 |
10.4 |
| 5.4 |
2 |
10.8 |
| 5.6 |
1 |
5.6 |
|
Σf = 6 |
Σf × x = 31.8 |
∴ Mean height of the family members
= Σfx/Σf = 31.8/6 = 5.3
Question 4.
State the formula to find the mode for a grouped data. Explain each term In it
(OR)
Write the formula of mode for grouped data and explain each term in it.
Solution:
Formula to find the mode for a grouped data
Mode = Z = l + (Σfx/Σf) × h
Where
l = Lower boundary of the modal class
h = Size of the modal class interval
f1 = Frequency of the modal class
f0 = Frequency of the class preceding the modal class
f2 = Frequency of the class succeeding the modal class
Question 5.
Find the value of Σfixi for the above data, where xi is the mid value of each class.
Solution:
Question 6.
The height of 12 members of a family are given below in the table.
| Height (in ft) |
5 |
5.2 |
5.4 |
5.6 |
| No.of family members |
3 |
4 |
3 |
2 |
Find the mean height of the family members.
Solution:
| Height (x) |
No.of family Members (f) |
f.x |
| 5 |
3 |
15 |
| 5.2 |
4 |
20.8 |
| 5.4 |
3 |
16.2 |
| 5.6 |
2 |
11.2 |
|
Σf = 12 |
Σfx = 63.2 |
Mean height of the family = Σfx/Σf
= 63.2/12 = 5.266 feet = 5.27 feet
Question 7.
Find the median of first six prime numbers.
Solution:
First six prime numbers
Median of the above data,
If n is even then the median will be the average of the (n/2)th and (n/2 + 1)th observations.
(n/2)th term = (6/2) = 3rd term
(n/2 + 1)th term = (6/2 + 1)th = 3 + 1 = 4th term
Median = (3rdterm +4thterm/2) = 5+7/2 = 6/2 = 6
∴ Median of first six prime number is 6.
10th Class Maths Statistics 8 Mark Important Questions
Question 1.
Find the missing frequencies in the following frequency distribution if it is known that the mean of the distribution is 50.
| xi |
10 |
30 |
50 |
70 |
90 |
| fi |
17 |
f1 |
32 |
f2 |
19 |
N = 120
Solution:
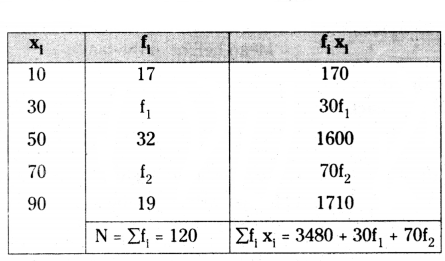
68 + f1 + f2 = 120
f1 + f2 = 120 - 68
f1 + f2 = 52 → (1)
Mean = Σfixi/Σfi = 3480+30f1+70f2/120 = 50
3480 + 30f1 + 70f2 = 50 × 120
30f1 + 70f2 = 6000 - 3480
30f1 + 70f2 = 2520
3f1 + 7f2 = 252 → (2)
(1) × 3 3f1 + 3f2 = 3 × 52
3f1 + 3f2 → (3)
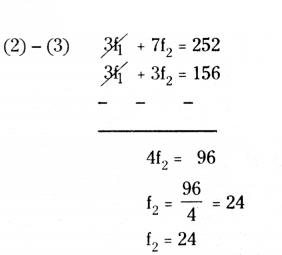
Put f2 = 24 in (1)
f1 + 24 = 52 ⇒ f1 = 52 - 24 ⇒ f1 = 28
∴ f1 = 28, f2 = 24
Question 2.
If the mean of the following distributions is 54, find the value of p.
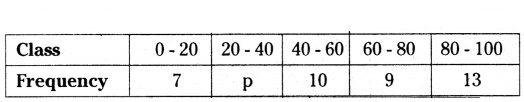
Solution:
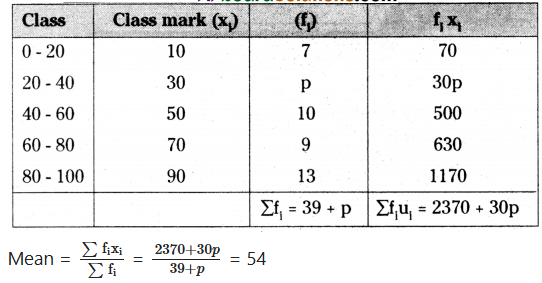
2370 + 30p = 54 (39 + p)
2370 + 30p = 2106 + 54p
2370 - 2106 = 54p - 30p
264 = 24p
P = 264/24 = 11
∴ P = 11
Question 3.
The following table gives weekly wages in rupees of workers in a certain commer¬cial organization. The frequency of class 43 - 46 is missing. It is known that the mean of the frequency distribution is 47.2. Find the missing frequency.
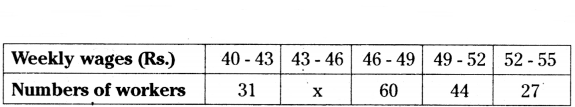
Solution:
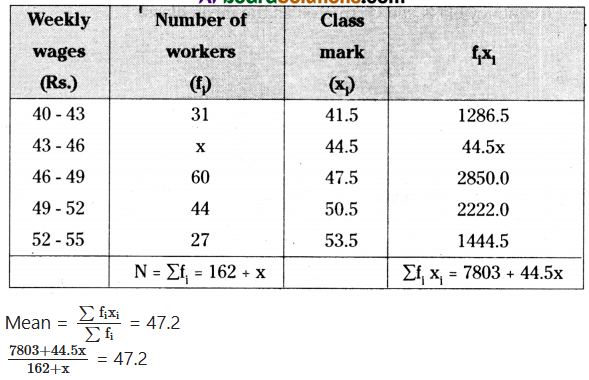
7803 + 44.5x = 47.2 (162 + x)
7803 + 44.5x = 47.2 x 162 + 47.2x
7803 - 7646.4 = 47.2x - 44.5x
156.6 = 2.7x
x = 156.6/2.7 = 58
∴ x = 58
Question 4.
The mean of the following frequency table 50. But the frequencies f1 and f2 in class 20 - 40 and 60 - 80 are missing. Find the missing frequencies.
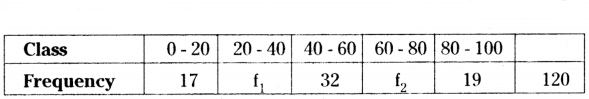
Solution:
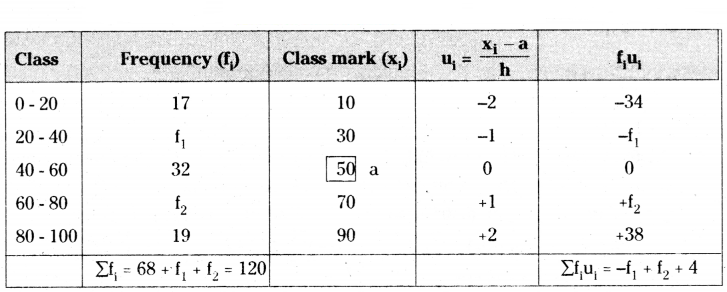
Note : Highest frequency class can be treated as the mean class.
Σfi = 68 + f1 + f2 = 120
f1 + f2 = 120 - 68
f1 + f2 = 52 → (1)
Mean = a + (Σfiui/Σfi) × h
a = class mark of the assumed mean class = 50
Σfi = Total frequency = 120
h = height of the class
Σfiui = -f1 + f2 + 4
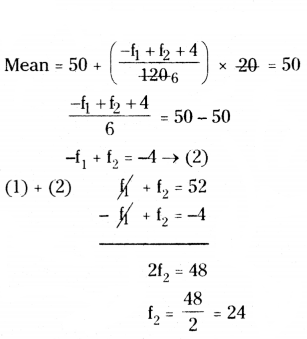
Put f2 = 24 in (1)
f1 + 24 = 52
f1 = 52 - 24 = 28 ⇒ ∴ f1 = 28, f2 = 24
Question 5.
The mean of the following frequency distribution is 62.8 and the sum of all the frequencies is 50. Compute the missing frequency f1 and f2.
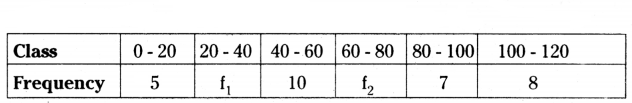
Solution:
Note : Highest frequency class can be treated as the mean class.
Σfi = 30 + f1 + f2 = 50
f1 + f2 = 50 - 30 = 20
f1 + f2 = 20 → (1)
Mean = a + (Σfiui/Σfi) × h
a = class mark of the assumed mean class = 50
xi = class mark
Σfi = Total frequency = 50
h = height of the class = 20
Σfiui = -f1 + f2 + 28
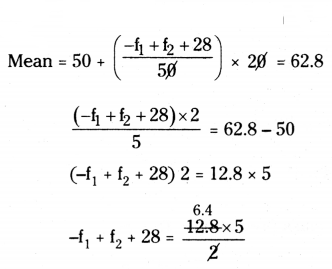
-f1 + f2 + 28 = 32
-f1 + f2 = 32 - 28
-f1 + f2 = 4 → (2)
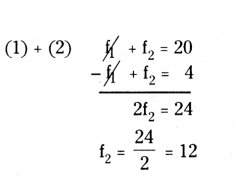
Put f2 = 12 in (1)
f1 + 12 = 20
f1 = 20 - 12 = 8
∴ f1 = 8, f2 = 12
Question 6.
If the median of the following frequency distribution is 46. Find the missing frequencies. Total frequency is 229.
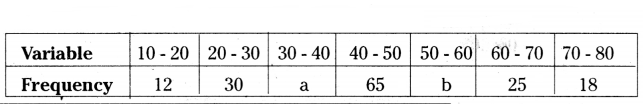
Solution:
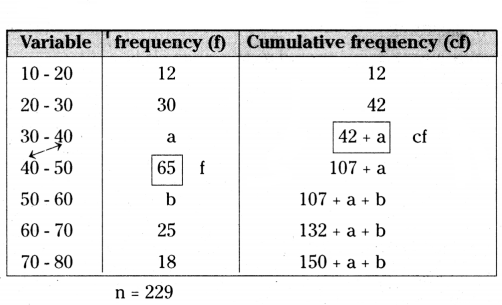
150 + a + b = 229
a + b = 229 - 150
a + b = 79 → (1)
Median = l + (n/2-cf/f) × h
l = lower limit of the median class = 40
n = Total frequency = 229
f = frequency of the median class = 65
h = height of the class = 10
cf = cumulative frequency of the class preceding = 42 + a
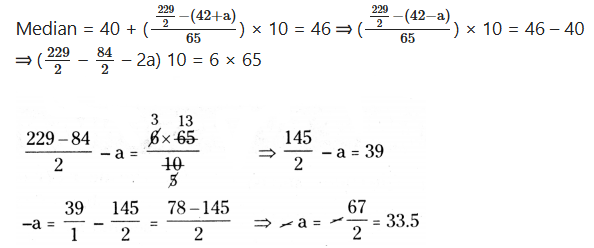
a = 34 (approximately)
Put a = 34 in (1)
a + b = 79
34 + b = 79 ⇒ b = 79 - 34 = 45 ⇒ ∴ a = 34 and b = 45
Question 7.
Compute the median of the following data
| Marks |
Number of students |
| More than 150 |
0 |
| More than 140 |
12 |
| More than 130 |
27 |
| More than 120 |
60 |
| More than 110 |
105 |
| More than 100 |
124 |
| More than 90 |
141 |
| More than 80 |
150 |
Solution:
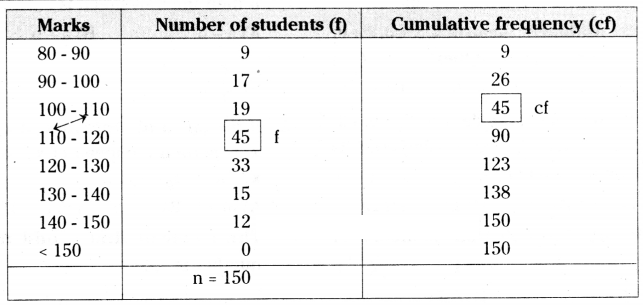
Note : Highest frequency class can be treated as the median class.
Median = l + (n/2-cf/f) × h
l = lower limit of the median class = 110, n = Total frequency = 150,
f = frequency of the median class = 45, h = height of the class = 10
cf = cumulative frequency of the class preceding = 45 O50
Median = 110 + (150/2-45/45) × 10 = 110 + (75-45/45) × 10 = 110 + 30×10/45
= 110 + 6.66 ⇒ ∴ Median = 116.66